Fortinet
This tutorial provides information and examples of how to configure Cloudflare Magic WAN with IPsec tunnels in conjunction with Fortinet FortiGate firewalls.
The FortiGate configuration settings presented here support bidirectional health checks as required by Cloudflare Magic WAN. However, they do not factor in any other traffic flows outside of the tunnel health checks. The configuration may need to be adjusted based on your current FortiGate configuration.
Testing Environment
The FortiGate configuration was tested on two different FortiGate firewalls:
- FortiGate Virtual Appliance version 7.0.8, running on VMware ESXi 6.5
- FortiGate FG80F, version 7.0.12
Magic WAN configuration
The first step to setting up Magic WAN is to add Magic WAN IPsec tunnels and Magic static routes to your Cloudflare account via the dashboard or API.
Before proceeding, ensure that you have the Anycast IPs associated with your account. Check with your Cloudflare account team if you do not yet have them.
Magic IPsec Tunnels
Cloudflare recommends customers configure two Magic IPsec tunnels per firewall/router — one to each of the two Anycast IP addresses.
-
Go to the Cloudflare dashboard and select your account.
-
Go to Magic WAN > Configuration.
-
From the Tunnels tab, select Create.
-
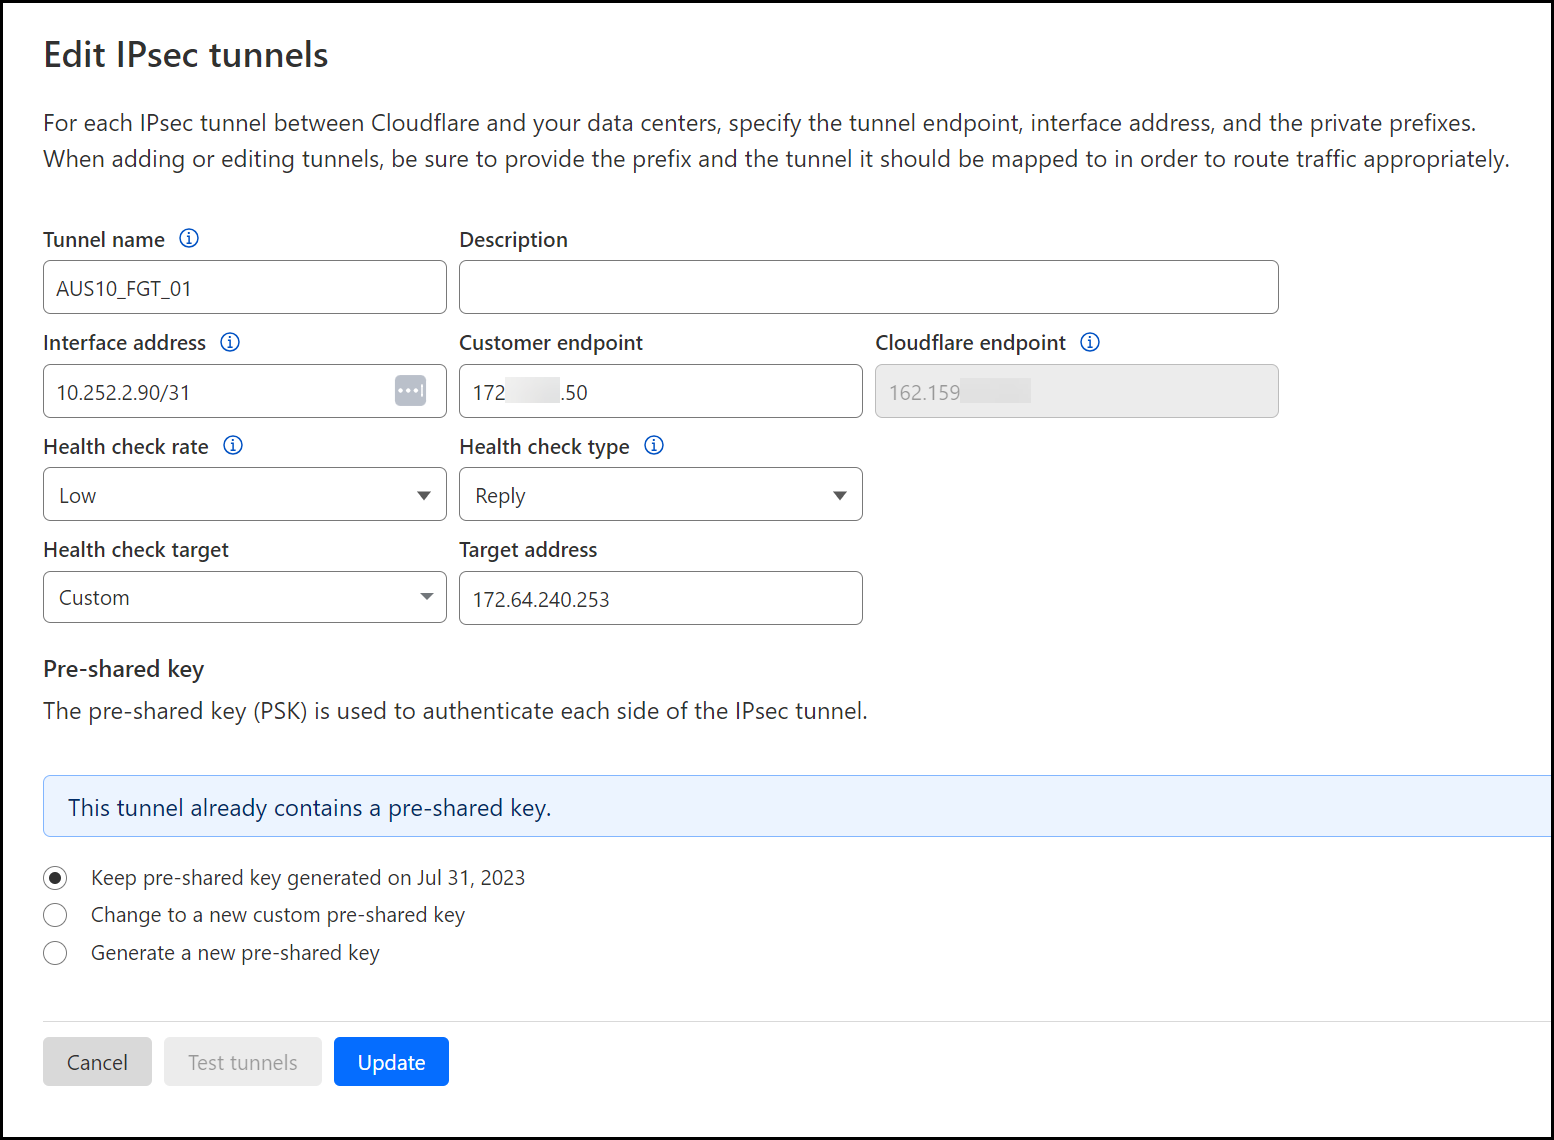
For the first IPsec tunnel, ensure the following settings are defined (refer to Add tunnels to learn about settings not mentioned here):
- Customer Endpoint: Enter your external/egress interface of the firewall.
- Cloudflare Endpoint: Enter the first of your two Anycast IPs.
- Health check rate: Low.
- Health check type: Reply.
- Health check target: Custom.
- Target address: The target address for the first tunnel is always
172.64.240.253. - Pre-shared key: Enter your own key or allow Cloudflare to define the key. Refer to Add IPsec tunnel for more information.
-
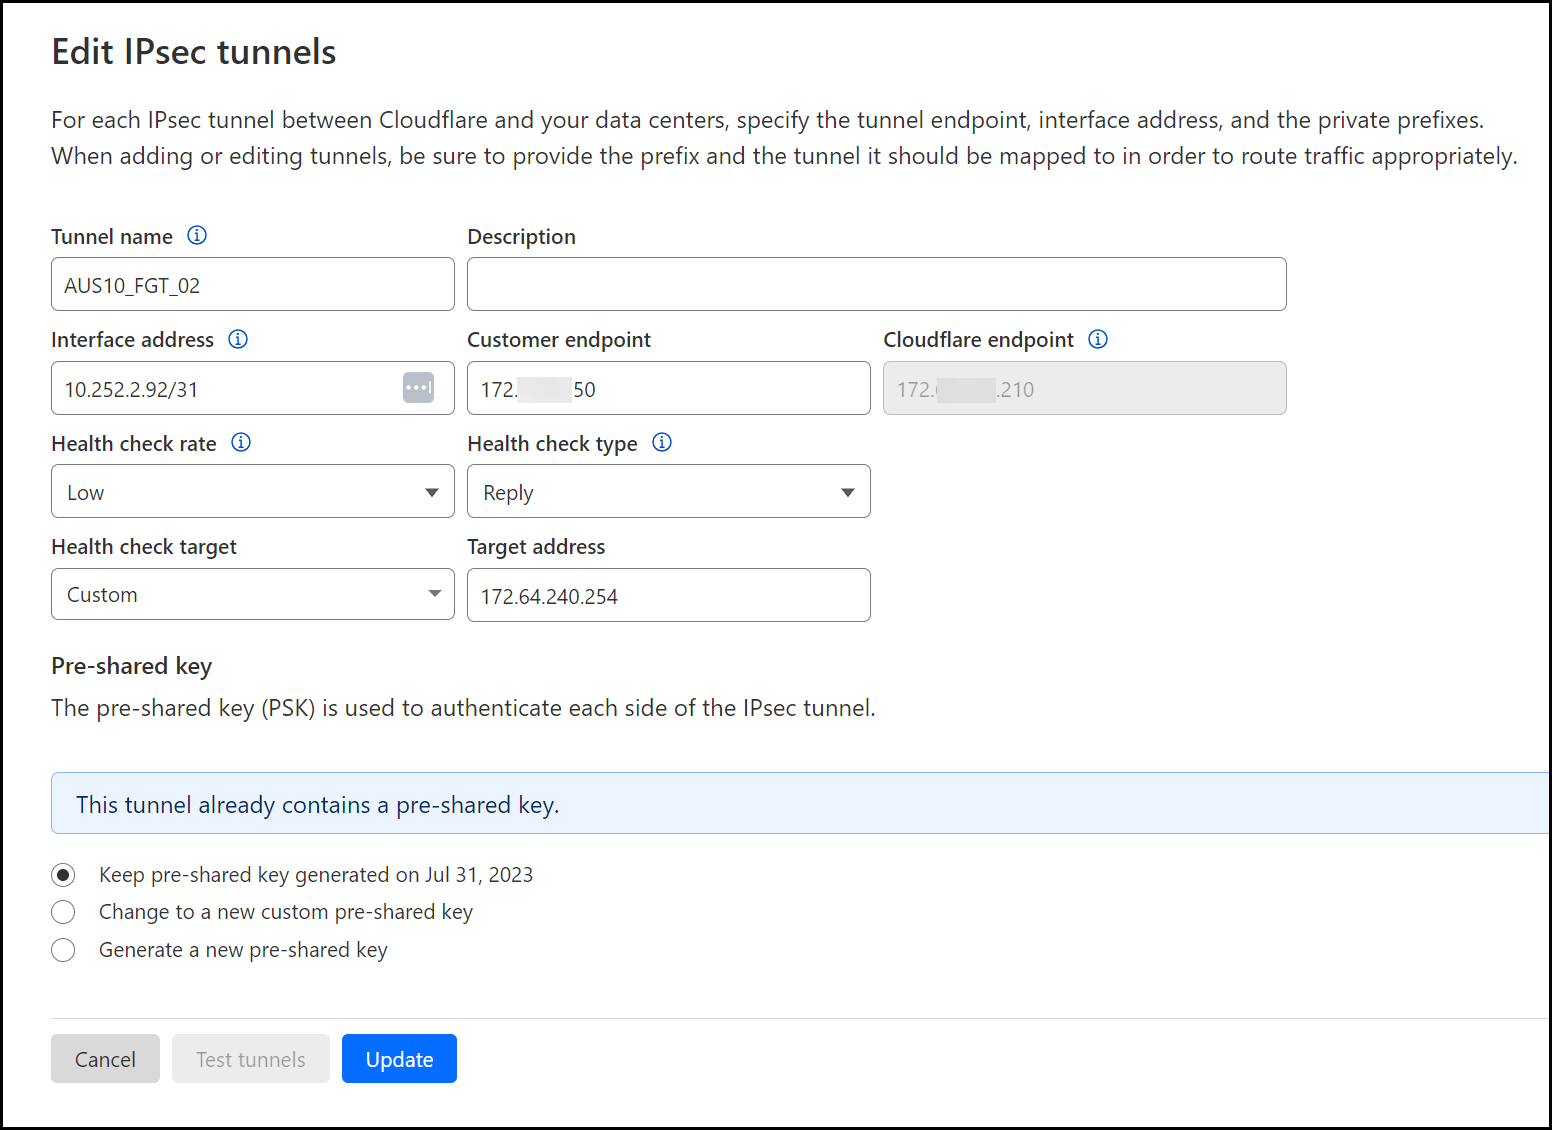
For the second tunnel, make the same changes as you did for the first tunnel (including creating a pre-shared key), and ensure the following additional settings are defined:
- Cloudflare Endpoint: Enter the second of your two Anycast IPs.
- Health check target: Custom.
- Target address:
172.64.240.254.
Magic static routes
Add two Magic static routes to define the IP address space that exists behind the Magic IPsec tunnels — one to each of the two Magic IPsec tunnels defined in the previous section.
By default, the Magic static routes are defined with the priority set to 100. Cloudflare leverages Equal Cost Multipath Routing (ECMP) and will load balance the traffic equally across the two tunnels. If you prefer to use an Active/Passive model, you can leave the default value for the first route set to 100, and set the value for the second tunnel to 150 (higher value is a lower priority).
-
Go to the Cloudflare dashboard and select your account.
-
Go to Magic WAN > Configuration.
-
From the Static Routes tab, select Create.
-
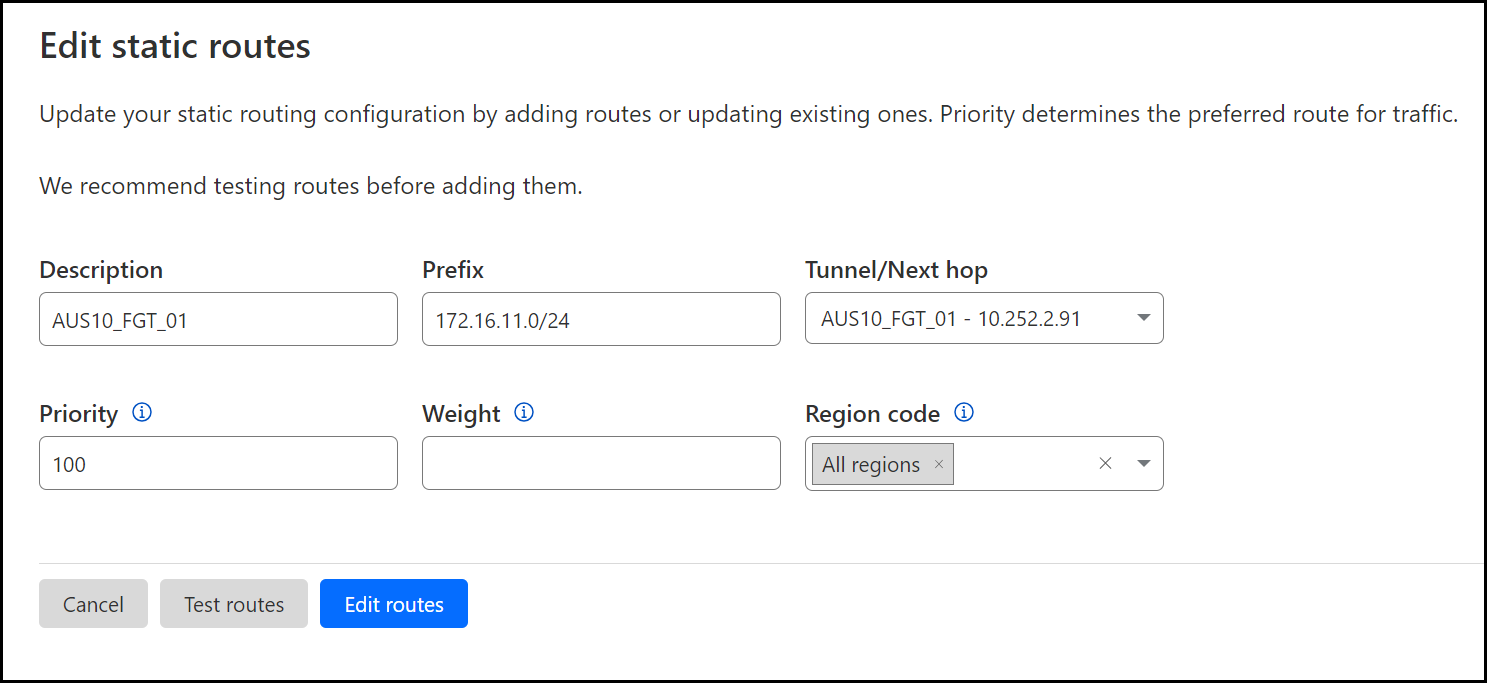
For the first route, ensure the following settings are defined (refer to Configure static routes to learn about settings not mentioned here):
- Prefix: Specify the RFC1918 subnet that exists behind the first Magic IPsec tunnel you have defined in the previous section.
- Tunnel/Next hop: Select your first tunnel (Tunnel 01 of 02).
- Priority: Leave the default value (
100). - Weight: Leave empty.
- Region code: Leave this set to
All Regions.
-
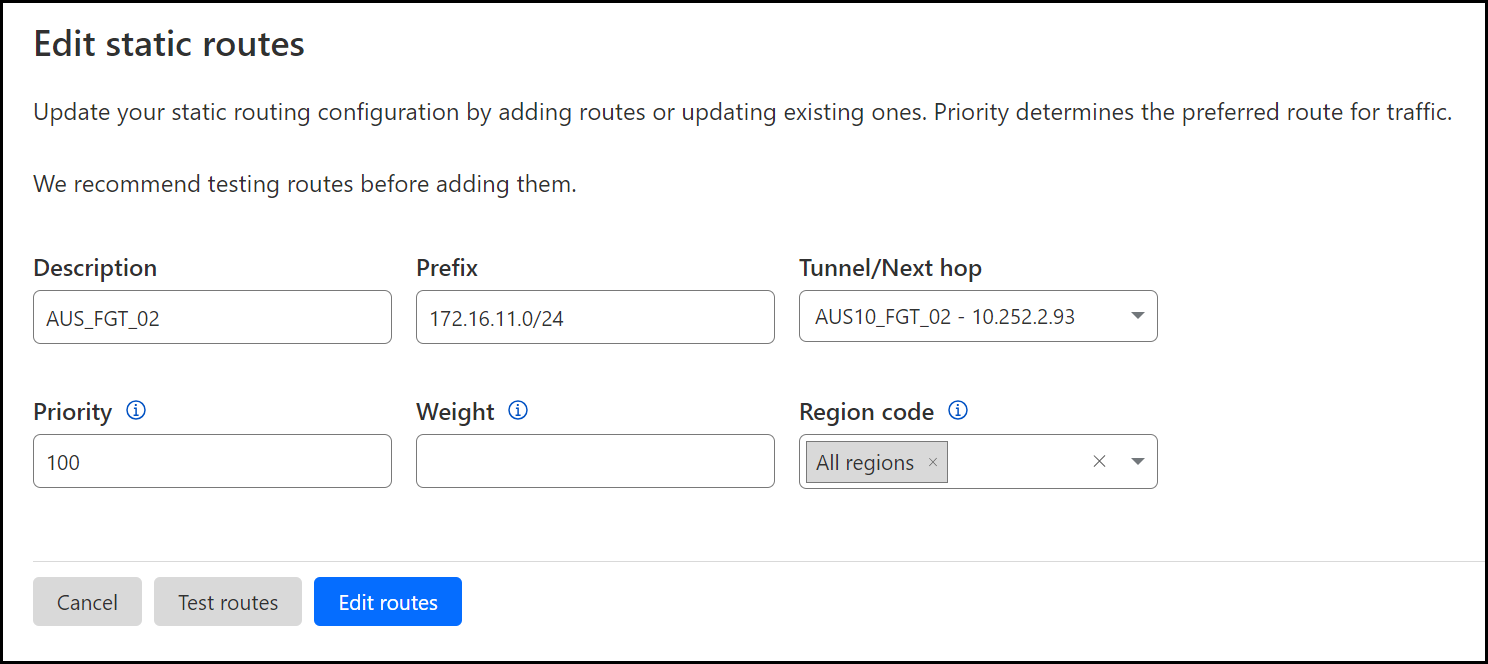
For the second route, ensure the following settings are defined:
- Prefix: Specify the RFC1918 subnet that exists behind the second Magic IPsec tunnel defined in the previous section.
- Tunnel/Next hop: Select your second tunnel (Tunnel 02 of 02).
- Priority: Leave the default value (
100). - Weight: Leave empty.
- Region code: Leave this set to
All Regions.
Fortinet FortiGate configuration
Enable asymmetric routing
To ensure health checks work as expected, enable asymmetric routing for ICMP. This option is required. Otherwise, the tunnel health checks which are critical for proper Magic WAN functionality will not work as designed.
Note that enabling asymmetric routing will affect FortiGate behavior. To learn more, refer to How FortiGate behaves when asymmetric routing is enabled.
Disable anti-replay protection
For route-based IPsec configurations, you will need to disable anti-replay protection. The command below disables anti-replay protection globally, but you can also do this per firewall policy. Refer to Fortinet’s documentation on anti-replay support per policy to learn more.
IPsec tunnels
Magic IPsec tunnels leverage a route-based site-to-site VPN model. This model relies on the use of virtual tunnel interfaces and routing to define the traffic that flows across the IPsec tunnels.
Configure two IPsec tunnels using the phase1-interface and phase2-interface objects.
The following examples assume wan1 is the external/egress interface of the FortiGate firewall.
Add Phase 1 interfaces
MWAN_IPsec_Tun1 corresponds to Tunnel 01 of 02 added earlier in the Cloudflare section of the configuration. MWAN_IPsec_Tun2 corresponds to Tunnel 02 of 02 added earlier in the Cloudflare section of the configuration.
Add Phase 2 interfaces
Add two phase2-interfaces — one for each of the two phase1-interfaces as follows:
Network interfaces
Virtual tunnel interfaces
Configure the virtual tunnel interfaces that were automatically added when specifying the set net-device enable within the phase1-interface settings.
These are the only settings that should need to be added to the virtual tunnel interfaces:
ip: The local IP address (specify with a/32netmask —255.255.255.255).remote-ip: The value associated with the interface address specified earlier in the Magic IPsec tunnels section (specify with a/31netmask —255.255.255.254).alias: This value is optional.
The following examples assume wan1 is the external/egress interface of the FortiGate firewall.
Validate communication across virtual tunnel interfaces
Once the virtual tunnel interfaces have been configured, you should be able to ping the IP address associated with the remote-ip attribute.
Below you have examples of a successful result from pinging across both of the virtual tunnel interfaces configured in the previous section:
MWAN_IPsec_Tun1
MWAN_IPsec_Tun2
Zone objects (optional)
This sample configuration assumes there are three zones configured on the FortiGate firewall. These zone objects are used in the policies referenced later in this document:
Trust_Zone: Contains the LAN interface(s).Untrust_Zone: Contains the WAN interface.Cloudflare_Zone: Contains both IPsec Tunnel interfaces.
Create Address Objects
Create Address Objects to represent the Cloudflare IPv4 address space as well as objects for the bidirectional health check Anycast IPs:
Configure Address Group Object
Create an Address Object that contains all of the Cloudflare IPv4 subnets as specified in the previous section. You can copy/paste the CLI commands below into an SSH terminal and the objects will get created automatically:
Add security policy
Add a firewall rule to permit the ICMP traffic associated with the reply style bidirectional health checks.
Policy-based routing
Policy-based routing rules are required to ensure the traffic associated with the bidirectional health checks received over a Magic IPsec tunnel is sent back across the same Magic IPsec tunnel.
Add two policy-based routing rules, one for each of the two Magic IPsec tunnels.
Monitor Cloudflare Magic IPsec tunnel health checks
The Cloudflare dashboard monitors the health of all Anycast tunnels on your account that route traffic from Cloudflare to your origin network.
The dashboard shows the view of tunnel health as measured from each Cloudflare location where your traffic is likely to land. If the tunnels are healthy on your side, you will see the majority of servers reporting an up status. It is normal for a subset of these locations to show tunnel status as degraded or unhealthy, since the Internet is not homogeneous and intermediary path issues between Cloudflare and your network can cause interruptions for specific paths.
Not all data centers will be relevant to you at all times. You can refer to the Average ingress traffic (last hour) column to understand if a given data center is receiving traffic for your network, and if its health status is relevant to you.
To check for Anycast tunnel health:
- Go to the Cloudflare dashboard and select your account.
- Go to Magic WAN > Tunnel health.
- In Cloudflare colos, you can choose one or more Cloudflare data centers to filter out the traffic that shows up in your Anycast tunnels. For example, if you chose the Lisbon data center, your Anycast tunnels would only show connections to that data center.
- Below, you have a list of all your Anycast tunnels, as well as their current health status. Find the tunnel you wish to inspect and select the arrow (>) before it to open its details.
- The details pane shows the connection status between different Cloudflare servers and your tunnel. Select Traceroute for details in one of the Cloudflare servers shown to check for issues between Cloudflare and your origin network.
Troubleshooting
Packet Capture
Packet captures allow you to determine whether or not the policy-based routing rules are working as expected.
The expected behavior should look like the examples below — traffic ingressing Tunnel 01 of 02 should egress the same tunnel.
Conversely, traffic ingressing Tunnel 02 of 02 should egress the same tunnel:
Flow Debugging
Flow debugging can be helpful when it comes to determining whether or not traffic is ingressing/egressing the firewall via the expected path. It takes steps much further than the sniffer packet captures in the previous section, but it creates a tremendous amount of logging and should only be enabled when absolutely necessary.
Additionally, customers will likely need to contact Fortinet technical support for assistance with interpreting the flow debug logs, as well as to obtain recommendations in terms of how to configure FortiGate to ensure flows are routed correctly based on the application’s requirements.
Disable Flow Debugging
The typical use of CTRL C will not stop Flow Debugging.
You can disable Flow Debugging simply by typing the following at any point while the debug logs are scrolling by: